Copper: long the deficit, wait for the price
Copper has a genuine structural shortage, but it is a 2029-and-beyond story, and the metal is not cheap today. COMEX spot sits at the top of the analyst fair-value range, the refined market runs a widening surplus into 2027, and concentrate tightness is not yet reaching refined output. I therefore hold no position today. I arm conditional orders in Freeport-McMoRan equity plus a defined-risk January 2027 call spread, and I initiate only on a wash-out to fair value or a confirmed supply-transmission signal. Day-one committed capital is zero, downside is bounded, and conviction rises on the triggers in section 8.
Commodities strategy. I recommend no outright copper position today, despite a structural-supply thesis I find sound. The metal trades at the top of its fair-value range, the refined market runs a surplus into 2027, and the genuine deficit does not arrive until about 2029. The edge sits in the entry, not in the instrument. I arm conditional orders in Freeport-McMoRan, ticker FCX, plus a defined-risk call spread, commit nothing on day one, and scale in only on a wash-out to fair value or a confirmed transmission signal.
| Metric | Detail |
|---|---|
| Recommendation | No position today. Arm conditional orders. Initiate only on a wash-out to fair value or a confirmed supply signal |
| Conviction | Low on an outright long now. High on the structural thesis over a multi-year horizon |
| Vehicle | FCX equity, plus a defined-risk FCX January 2027 call spread struck off the fill. COPX is a substitute |
| Horizon | Equity tail 2.5 to 4 years. Convexity to January 2027 |
| Day-one committed capital | Zero |
| Expected return, wash-out-fill branch | Roughly +60% to +80% on the filled equity. The call spread is a lower-probability convexity kicker, not the core return |
| Reward to risk | About 2.5 to 3.5 to 1 on the filled portion |
| Carry | Positive. FCX yields near 0.9%. No futures roll. The spread carries no theta, the daily decay of option value, until armed |
| Maximum loss | Bounded. Average tail loss near 4% of the account at the recommended size, mid-single digits in a worst-case gap. Option premium capped near 0.6% to 0.8% |
1. The structural case is real
The bull case is genuine and quantified. Treatment and refining charges, the fees smelters earn to turn ore concentrate into metal, sit at record lows. Mine grades have fallen roughly 40% since 1991. A new mine takes about 17 years from discovery to first production.
The forecasts follow from that scarcity. S&P Global sees a cumulative concentrate deficit near 3 million tonnes by 2036. The International Energy Agency, the IEA, sees a refined gap near 30% of demand by 2035. Goldman Sachs puts the first refined deficit around 2029.
Demand compounds the squeeze. Power grids, electric vehicles, and data centers all draw heavily on copper. State Grid in China plans a 40% spending rise across 2026 to 2030. An electric vehicle uses three to four times the copper of a combustion car. I hold this thesis with high conviction over a multi-year horizon. The problem is timing, not direction.
2. Why the outright long has no edge today
The obvious trade is to buy copper futures here. That expression fails on price and balance, not on the long-run story. COMEX copper, the U.S. exchange contract, trades near 6.38 dollars per pound. That sits above every current analyst fair-value estimate (Exhibit 1). Goldman puts no-tariff fair value near 5.81 dollars. UBS and Bank of America cluster between 6.00 and 6.12 for 2027. Spot offers no margin of safety.
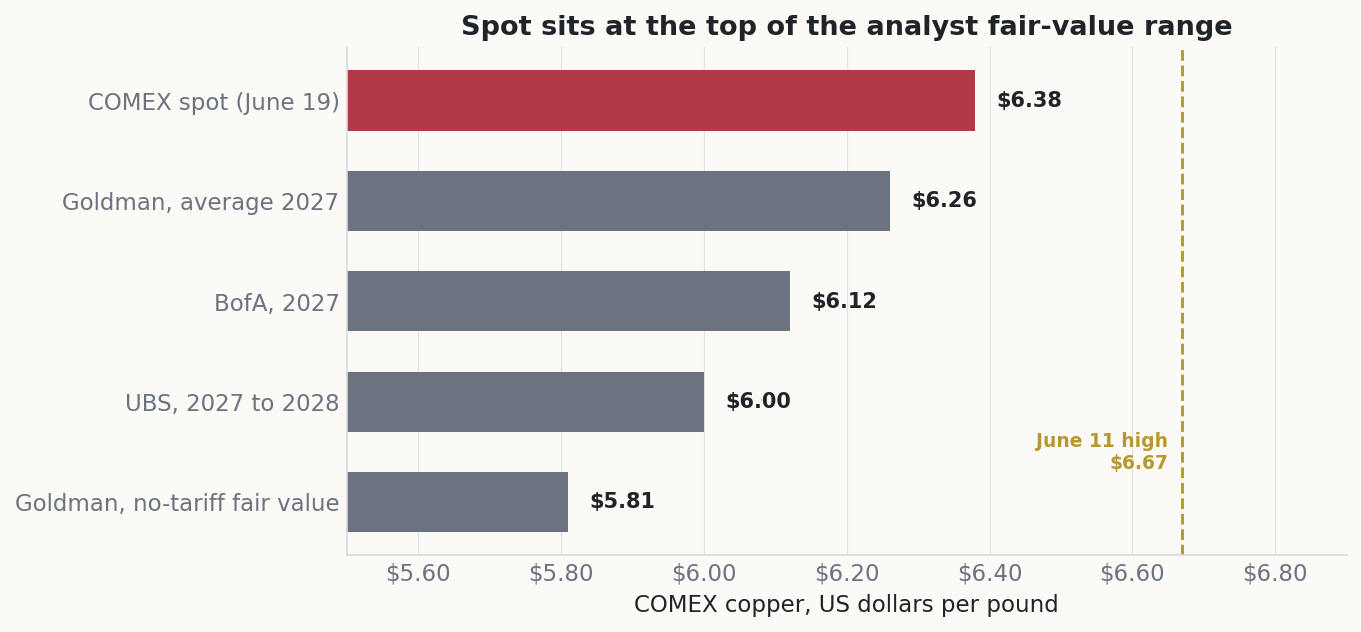
Exhibit 1. COMEX spot against the current analyst fair-value range. Spot sits at the top of the range, above every estimate, so a flat long pays no discount.
The near-term balance is worse for a bull. The International Copper Study Group, the ICSG, sees a refined surplus of 96 thousand tonnes in 2026, widening to 377 thousand in 2027 (Exhibit 2). Goldman models a wider 490 thousand tonne surplus this year. A shortage thesis does not pay while the market is oversupplied and the surplus is growing.
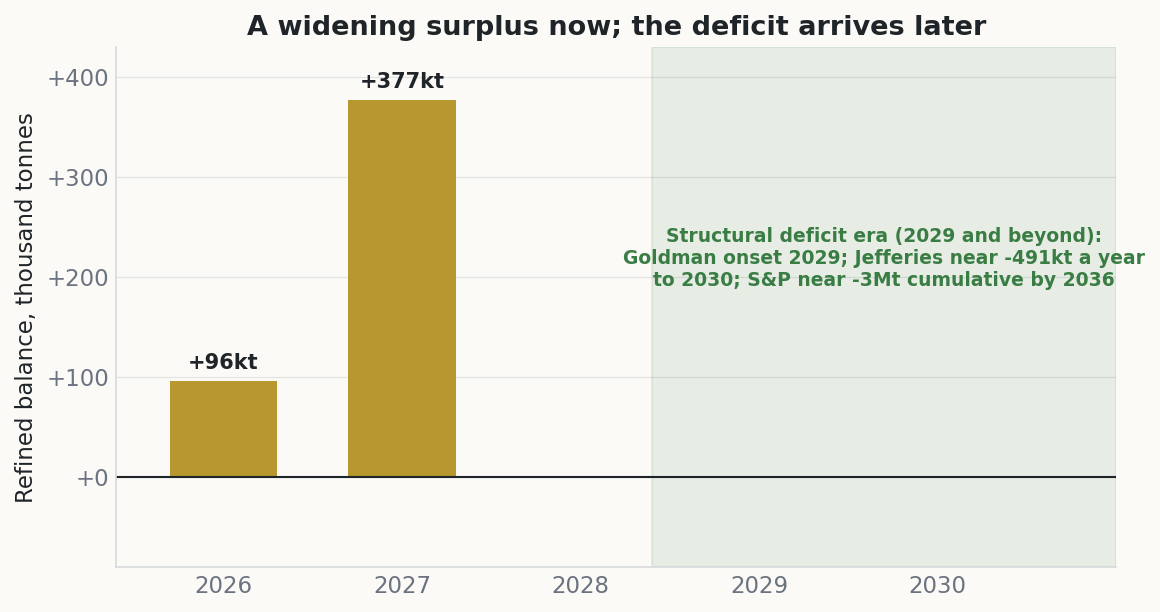
Exhibit 2. Refined balance by year, ICSG. The surplus widens before it flips; the deficit is a 2029-and-beyond event that no listed contract cleanly reaches.
3. The bridge that is not binding
Concentrate tightness is real, but it has not reached the refined market. Smelters earn treatment and refining charges to process concentrate. Those charges collapsed to zero at the 2026 benchmark, and the spot figure turned negative near minus 50 dollars per tonne (Exhibit 3). That reading signals a severe raw-material shortage.
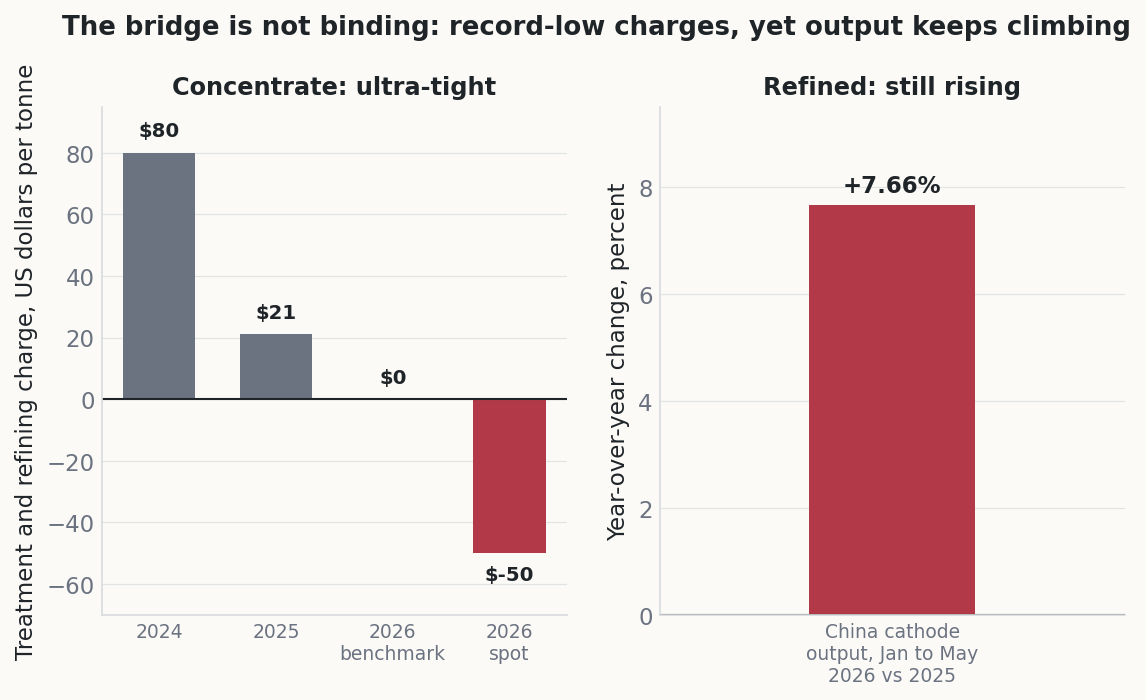
Exhibit 3. Concentrate is ultra-tight, yet refined output keeps rising. Until Chinese cathode output actually falls, raw-material scarcity does not become refined scarcity.
The refined side tells the opposite story. Chinese cathode output rose 7.66% year over year from January to May. Smelters keep running on by-product credits, the revenue from recovering gold, acid, and other materials, and refuse to cut. Pledged Chinese smelter reductions remain near zero percent realized. Until output falls, concentrate scarcity does not become refined scarcity. The lead indicator is moving the wrong way.
4. Why I express the view through equity, not futures
Vehicle choice decides this trade. One piece of market structure frames it: the U.S. COMEX price carries an import premium over the international London Metal Exchange, or LME, price, a gap I call the basis, and a prospective U.S. import tariff inflates it further. I reject three obvious expressions for concrete reasons. First, deferred copper futures: the COMEX curve is in contango, with later-dated prices above spot, so a long pays to roll into more expensive contracts and overpays for that tariff-inflated spot. Second, long-dated copper options: open interest beyond December 2026 is near zero, so no market exists at the deficit horizon. Third, copper micro options: they do not trade.
I use Freeport-McMoRan common stock instead. The equity has no expiry and no roll cost. It pays a dividend near 0.9% while I wait. It carries a recovery ramp at the Grasberg mine in Indonesia, a core Freeport asset, where output climbs back toward full volume into 2028. For defined-risk upside I add an FCX January 2027 call spread, struck off the actual fill rather than a fixed strike (section 5). The Global X Copper Miners ETF, ticker COPX, is an acceptable substitute when single-name risk is unwanted.
FCX is not a clean copper proxy, and I size it knowing that. A multi-factor regression puts its copper beta near 1.9, so a headline FCX long carries close to twice the copper exposure of its dollar notional (Exhibit 4). It also embeds a long in gold, through the Grasberg by-product, a long in the broad equity market, and a short in the dollar. To hold pure copper I would short those three factors against the position. Absent that, I size for the extra beta and treat the embedded bets as part of the risk.
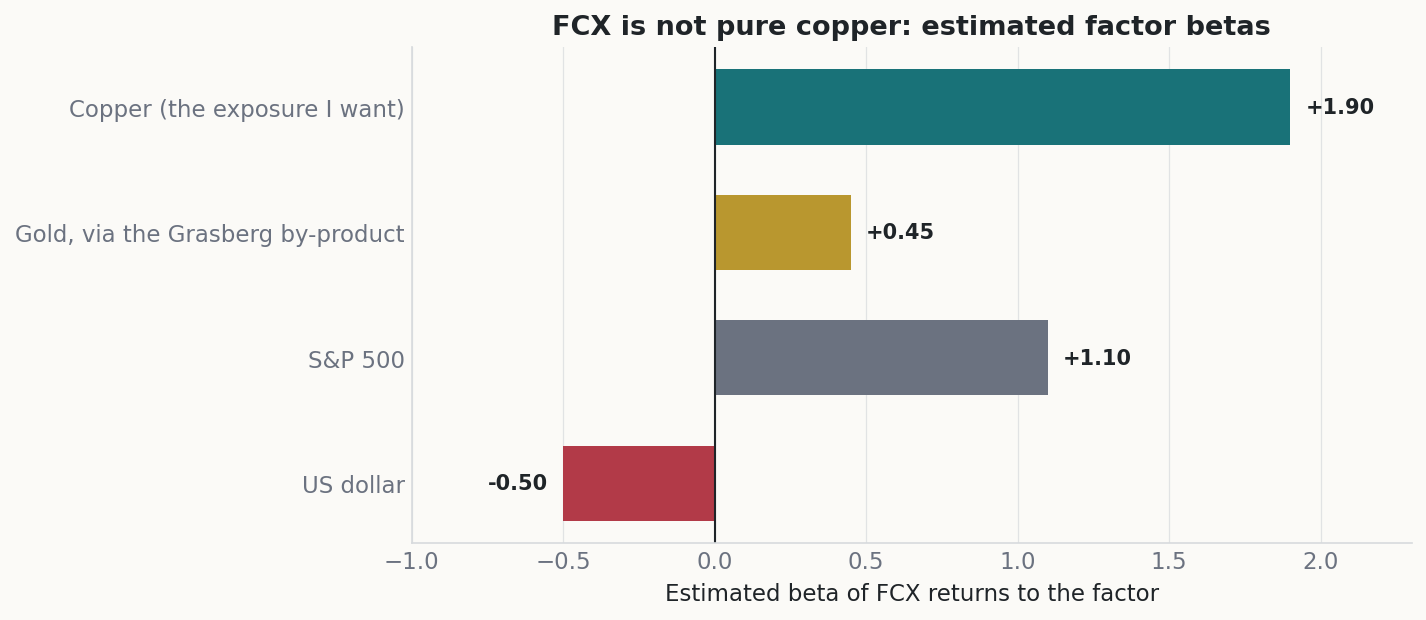
Exhibit 4. Estimated FCX factor betas. The copper beta near 1.9 is the exposure I want; the gold, equity, and dollar betas are embedded bets a clean copper position would hedge.
5. The conditional entry plan
I commit nothing at current levels (Exhibit 5). FCX trades near 68.68 dollars, above its 58.75 dollar consensus price target, with a relative strength index near 75. That index runs from 0 to 100, and readings above 70 flag an overbought market. Copper sits below its June 11 record of 6.67 dollars, with crowded speculative positioning. Chasing strength here carries no edge.
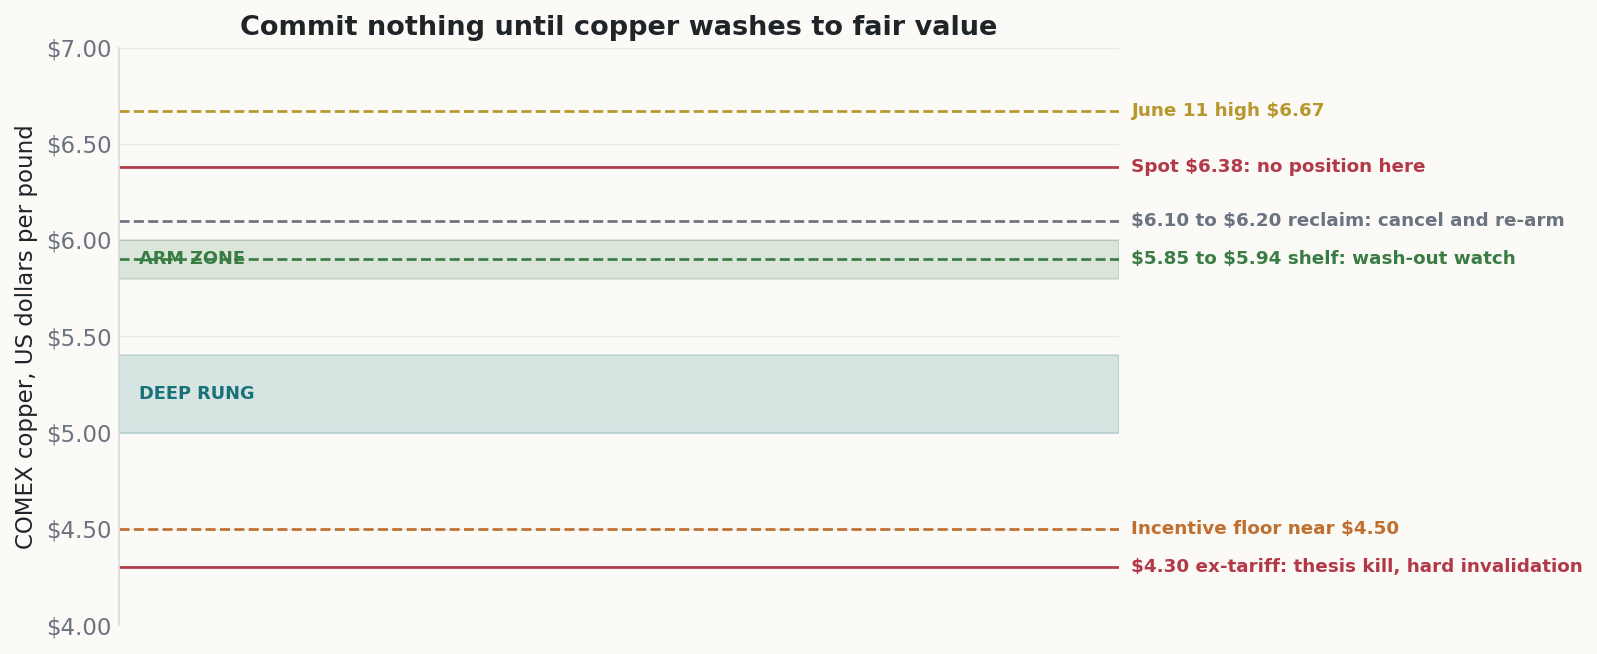
Exhibit 5. The conditional level map. I arm orders into the 5.80 to 6.00 fair-value zone, add on a deeper basis collapse, and kill the thesis below 4.30 on a tariff-free basis.
I rest two conditional orders, both gated on the same wash-out logic. The first is a deep buy-limit in FCX. It engages only when copper closes a week below the 5.85 to 5.94 shelf, toward the 5.80 to 6.00 fair-value zone. The second is the call spread. I arm it on the same signal, after option volatility resets. I strike it off the actual fill, near 15% and 45% out of the money. Fixed 80 and 95 strikes suit an entry near the current price. After a wash-out into the low 50s they sit far out of the money, so the strikes travel down with the fill. A genuine wash-out most likely needs a soft outcome from the June 30 U.S. Section 232 report, the trade-law review that could place national-security tariffs on imported copper. If copper instead reclaims 6.10 to 6.20 on a weekly close, I cancel both orders and re-arm later.
6. Construction and sizing
Day-one committed capital is zero by design. On a 250 thousand dollar account I cap the FCX equity bid near 15 thousand dollars of notional, about 6% gross. That is the size at which the modeled tail stays inside a 4% budget for expected shortfall, the average loss across the worst outcomes. I cap a single tariff-gap fill near 7 thousand dollars, so one weekend gap cannot fill the whole bid. It is a buy-limit, never a buy-stop, so a gap fills at or below my price.
The call-spread premium is capped near 0.6% to 0.8% of equity, with loss limited to the debit. I hold a book-level copper-beta cap, because the equity and the spread draw down together. FCX also carries close to twice the copper beta of its notional, which the cap accounts for. The realized tail, a full fill followed by a gap toward my invalidation, runs near 4% of the account in expected-shortfall terms, and mid-single digits in a worst-case gap. The equity carries no theta and no roll, so waiting costs nothing beyond opportunity.
7. What gets paid
The structure earns only in the wash-out branch, and that is the intent. If the deep bid fills in the low-to-mid 50s, a mean reversion in copper re-rates FCX toward its 58 to 69 dollar consensus zone. That move is the first and highest-probability target.
A fuller advance to 85 to 95 dollars needs the Grasberg ramp plus a modest re-rating of the copper forward curve, a shift out of its current contango toward the deficit. Each 10 cent move in copper adds roughly 400 million dollars to FCX earnings before interest, taxes, depreciation, and amortization. The 110 to 130 dollar case is a pure 2029-and-beyond deficit overshoot, carried only by the no-expiry equity. In the modal branch the orders never fill and I hold zero exposure (Exhibit 6). That result is the correct one, not a failure.
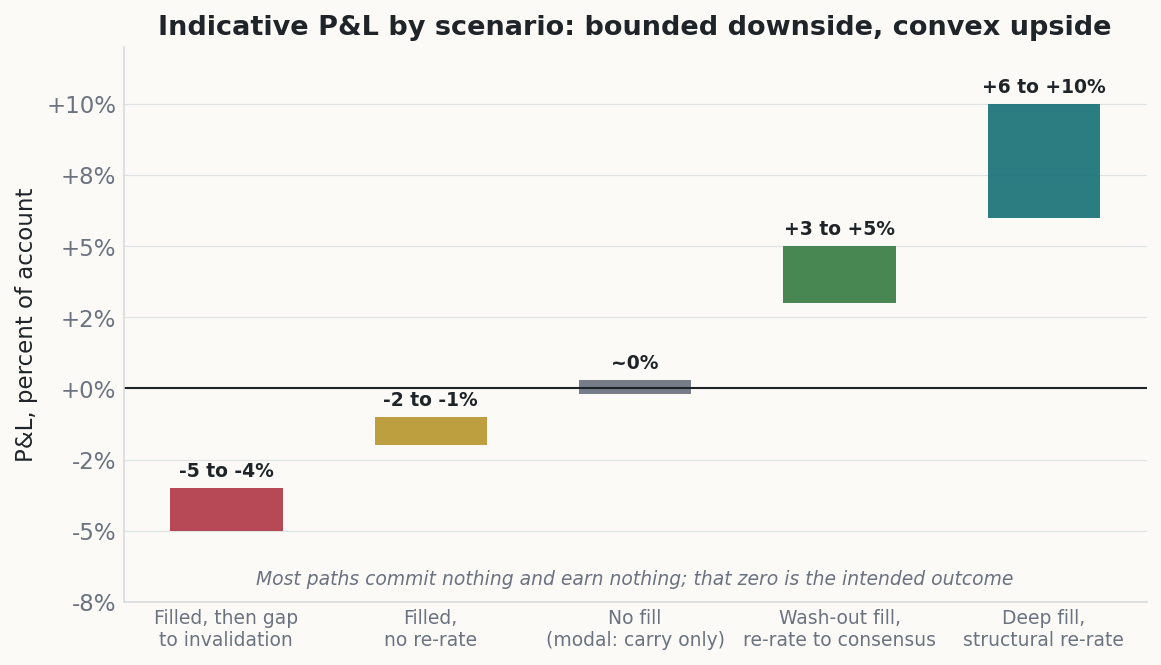
Exhibit 6. Indicative profit and loss by scenario, as a percent of the account. The downside is bounded, the upside is convex, and the modal path commits nothing. Hypothetical and point-in-time.
8. The triggers that raise conviction
My conviction on an outright long rises from low to high on four signals. The first and most important is a genuine month-over-month cut in Chinese cathode output, against the current 7.66% annual rise. That cut is the concentrate-to-refined bridge starting to bind.
The remaining three confirm the setup. The second is a draw in LME on-warrant stock, the exchange inventory available for delivery. I pair it with the cash-to-three-month spread widening from its current 32 dollar backwardation, where nearby metal trades above the deferred price, a sign of physical tightness. The third is a Commitments of Traders report, the CFTC COT, showing managed-money net length, the net long held by speculative funds, resetting below 60 thousand contracts from about 72 thousand now. A lower reading means crowded positioning has cleared. The fourth is the wash-out entry itself, near 5.80 to 6.00 dollars. When the first signal prints or the fourth arrives, this becomes a high-conviction long.
The clock matters as much as the levels. While output keeps rising the trade rarely arms, so most of the time I hold nothing (Exhibit 7). A genuine cathode cut changes that fast, which is why I track the monthly prints rather than a calendar date.
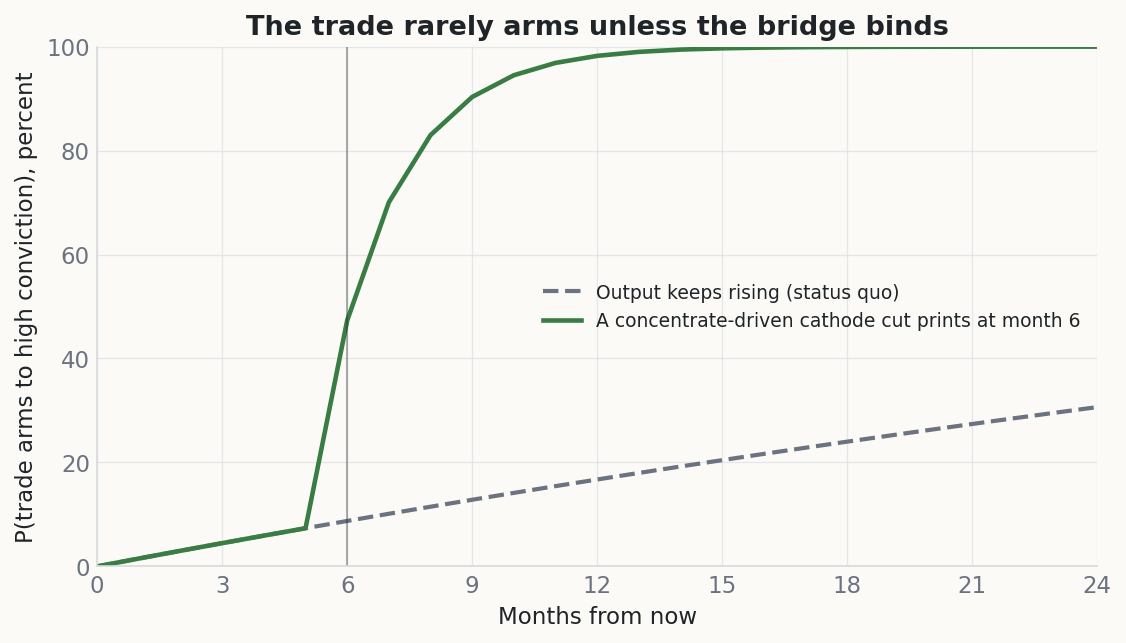
Exhibit 7. An illustrative probability that the trade arms to high conviction. With output still rising it rarely arms; a genuine cathode cut flips the clock fast. A framework, not a forecast.
9. Catalysts and timeline
The catalyst path is dated. The June 30 Commerce Section 232 report is the near-term binary. A delay or rejection collapses the U.S. price premium and triggers the wash-out I want to buy. Enactment instead spikes the U.S. contract and leaves my orders empty.
Lower-frequency data test the thesis as it develops. Monthly Chinese cathode prints test the transmission signal. Weekly LME stock and CFTC positioning data test the tactical setup. The Grasberg ramp runs through late 2027 into early 2028. The hard checkpoint is end-2027: if treatment charges have not recovered, cathode output has not turned negative, and a tariff-free backwardation has not emerged, the deficit is not arriving on my clock, and I scale back the residual structural position I am left holding.
10. Risks and invalidation
I measure the kill on the tariff-free price, not on the distorted U.S. contract. A weekly close below 4.30 dollars per pound, on an LME-equivalent basis, is hard invalidation. That level sits under the roughly 4.50 dollar incentive price that new mines need to proceed. The thesis is also dead if the ICSG, Wood Mackenzie, or CRU revise the balance to a surplus through 2030. A June 30 disappointment is not invalidation: it is the buy trigger.
Two further risks deserve a name. A Grasberg ramp slip past early 2028 halves the equity leg, regardless of price. A higher-for-longer dollar regime can cap the re-rate even after a good entry. The dollar index sits near a 15-month high, and the market prices a December rate hike at about 75%. Copper carries a strong negative correlation to the dollar, so that backdrop is a headwind the trade must ride through.
11. The bear case in plain terms
I hold the other side honestly. The market that prices copper runs a surplus, and that surplus is widening, not shrinking. The concentrate squeeze has failed to move refined output for two years. Spot copper offers no discount to fair value, so a flat long needs perfection.
The demand and supply detail cut the same way. Scrap supply is rising and caps the upside. Chinese refined demand fell about 8% year over year late in 2025, and electric-vehicle output softened. The structural deficit is real, but a multi-year thesis does not justify paying a record price into a glut. The disciplined position is to wait, with bounded risk, for the market to come to me.
Disclosures
This document is produced for informational purposes only. It is not investment advice, nor an offer or solicitation to buy or sell any security or derivative. The analysis reflects my views as of June 19, 2026 and is subject to change without notice. Figures are drawn from a point-in-time research snapshot and have not been updated for subsequent market moves. The scenario analysis is hypothetical and is not a forecast or a guarantee of future results. Options carry the risk of total loss of premium, and commodity exposure can produce losses beyond initial estimates in a gap. I may hold positions in the securities referenced. Readers should perform their own due diligence and consult a licensed adviser before acting.
Sources used: International Copper Study Group, International Energy Agency critical minerals, S&P Global Commodity Insights, copper, Freeport-McMoRan investor relations, CFTC Commitments of Traders, London Metal Exchange copper, CME Group copper futures, U.S. Bureau of Industry and Security Section 232 investigations, Reuters commodities coverage.